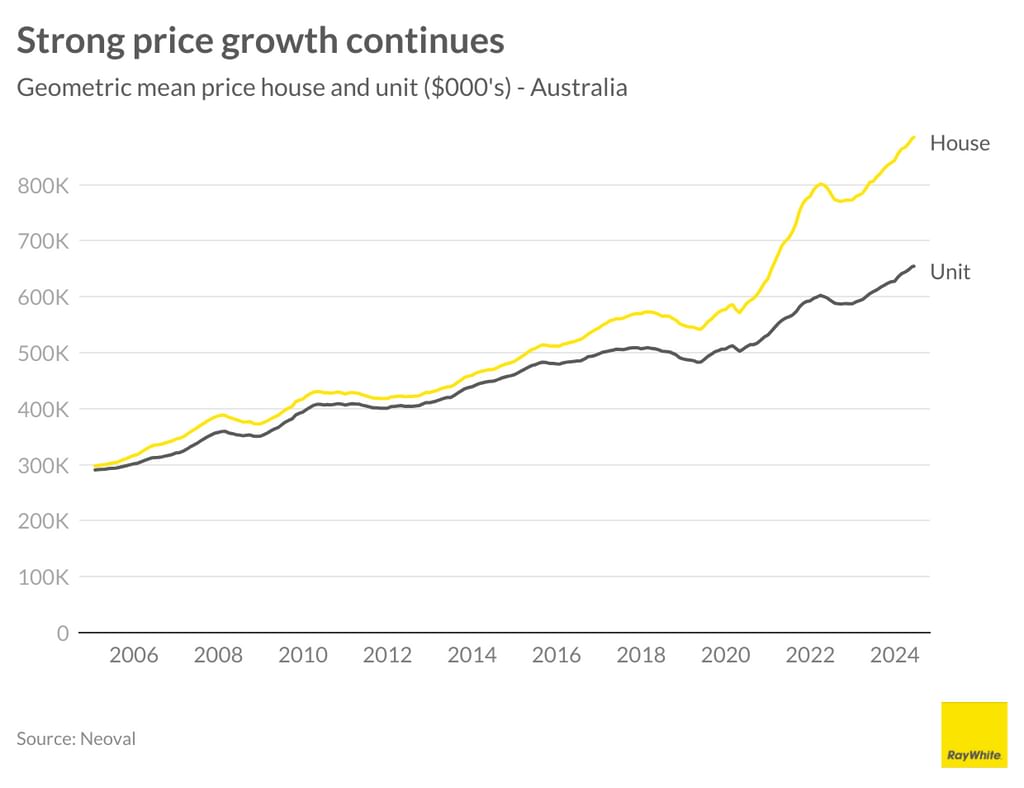
Australian residential property values have continued their upward trend in recent months, though June saw a deceleration with both houses and units recording a modest 0.2 per cent monthly increase. The ongoing scarcity of available properties and limited listings has intensified competition, driving up prices in both capital cities and regional markets.
The recent inflation surge has shifted discussions from potential interest rate cuts to possible increases, with some speculating a hike as early as August. This shift is expected to temper property listings and sales volumes, as higher borrowing costs may further strain affordability and cause delays in purchasing decisions. Over the past year, house prices have experienced a significant 9.5 per cent increase, bringing the national median to $886,818. Similarly, unit prices have risen by 7.1 per cent annually, reaching a median of $656,066 nationwide.
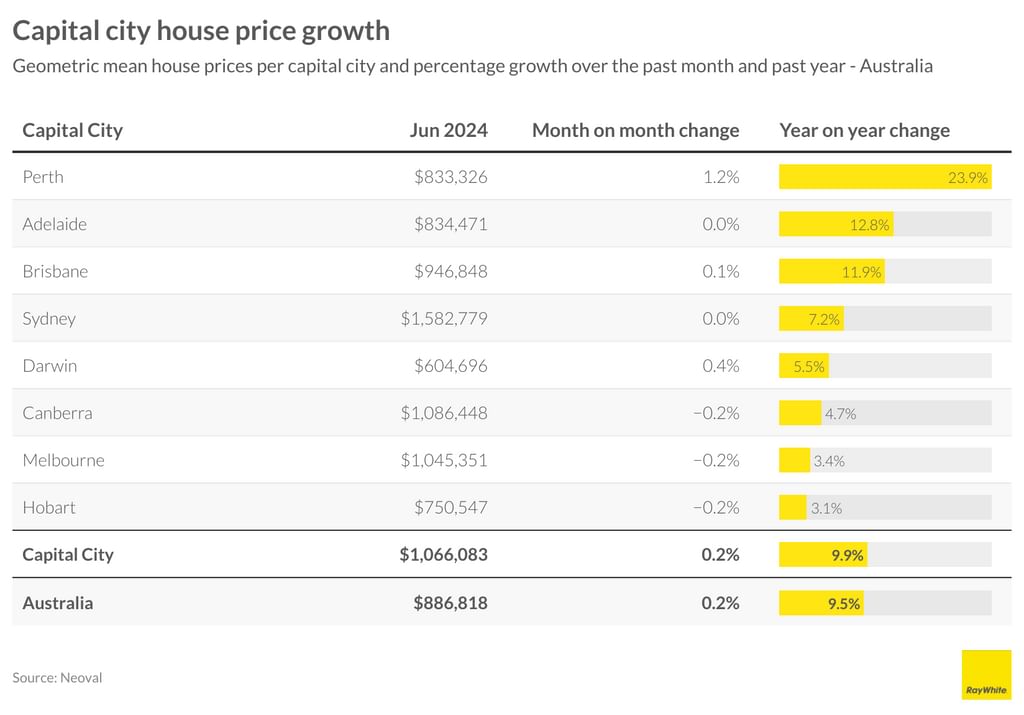
The past month witnessed a softening in price growth across several markets. Adelaide and Sydney have both paused their upward trends, showing no change, while Brisbane experienced a minimal increase of 0.1 per cent. In contrast, Perth maintains its growth momentum, recording a 1.2 per cent monthly rise, which contributes to an impressive annual growth of 23.9 per cent, pushing the mean price to $833,326.
Canberra, Melbourne and Hobart have all entered negative territory with a 0.2 per cent monthly decline. These markets also demonstrate the most modest annual value increases: Canberra up by 4.7 per cent, Melbourne by 3.4 per cent, and Hobart, with limited activity, seeing just a 3.1 per cent yearly growth to $750,547. Darwin remains the most affordable capital city with a mean price of $604,696, showing a 0.4 per cent monthly increase (5.5 per cent over the year).
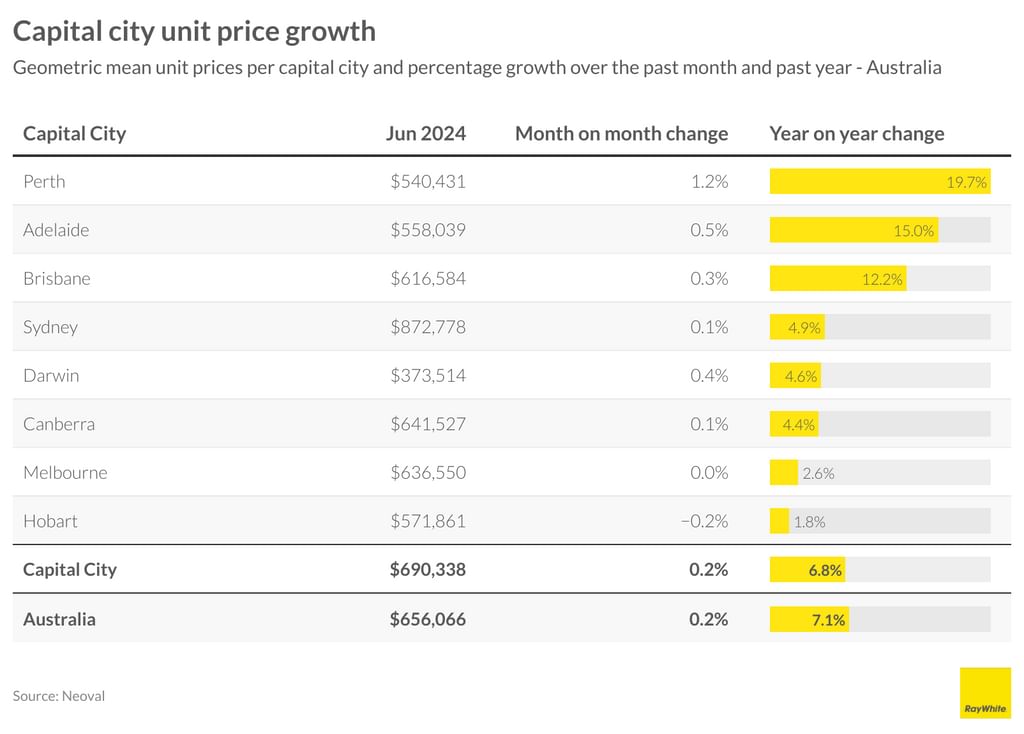
In the past month, capital city unit markets have mirrored trends seen in the housing sector. Perth leads the pack with the highest monthly growth of 1.2 per cent, translating to a 19.7 per cent annual increase and a mean price of $540,431. Adelaide has solidified its position as another growth market, rising 0.5 per cent this month, while Brisbane’s growth has been more modest at 0.3 per cent. However, annual increases in these markets have been robust, with Adelaide up 15 per cent and Brisbane up 12.2 per cent.
Sydney and Canberra both recorded a slight 0.1 per cent monthly increase, while Darwin continued its upward trend with a 0.4 per cent monthly gain (4.6 per cent annually). Hobart stands out as the only city showing a decline, dropping 0.2 per cent to $571,861, representing a mere 1.8 per cent annual change. Melbourne remained static over the month, with its annual growth falling behind the national capital city average of 6.8 per cent.
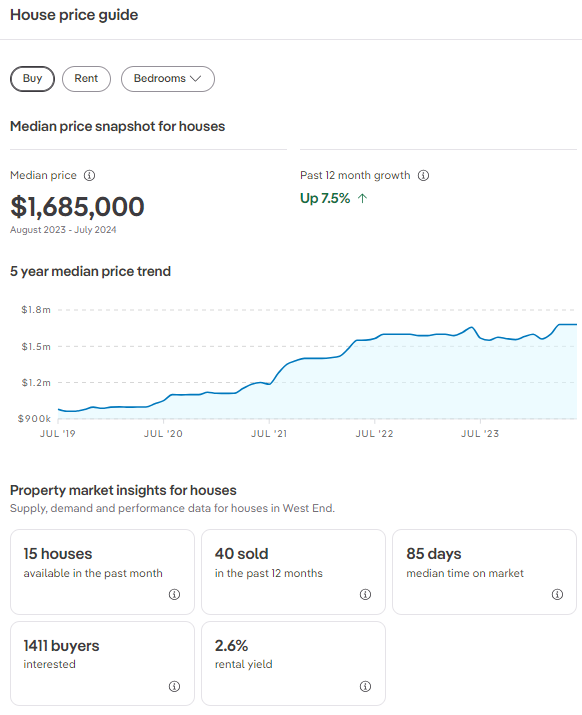
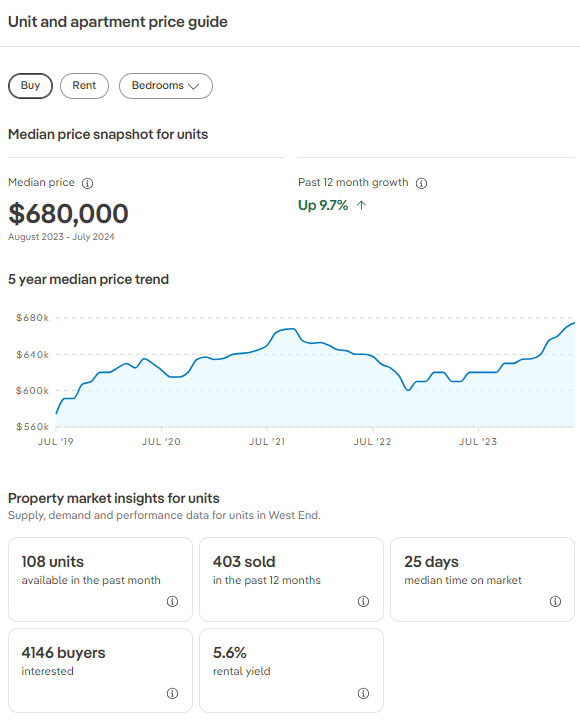
Average West End Sale Prices July 2024
1 bed apartment $468,750 (Low $450,000 High $582,500)
2 bed apartment $747,475 (Low $690,000 High $950,000)
3 bed apartment $1,451,750 (Low $1,300,000 High $2,351,777)
House $1,685,000
West End Apartment Data – REA 2/8/2024
West End House Data – REA 2/8/2024