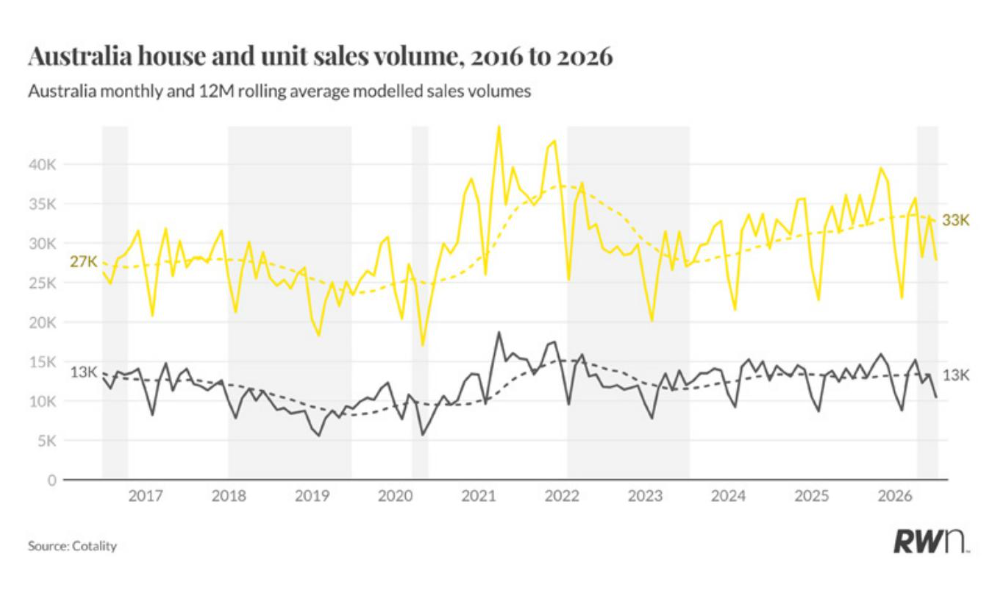
Monthly sales volumes eased in June, with an estimated 27,931 houses and 10,489 units changing hands nationally, down from 33,430 houses and 13,305 units in May. This follows a broadly similar pattern to June last year, when volumes also stepped down from the May result of 36,105 houses and 14,100 units, though this year’s June figure sits below the same month in 2025 for both property types.
The 12-month rolling average, a more reliable read on the underlying trend, tells a steadier story. Houses are averaging 32,725 sales a month on a rolling basis and units 13,115, both little changed from May’s 33,096 and 13,312 and broadly in line with the levels recorded through most of the past six months. Volumes have held in a relatively narrow band since February, between roughly 32,700 and 33,600 for houses, suggesting the softer clearance rates and bidder numbers discussed elsewhere in this report have not yet flowed through to a material change in the pace of transactions. Whether June’s monthly dip marks the start of a genuine slowdown or simply reflects the usual seasonal step down into the middle of the year will become clearer as the rolling average is updated over the coming months.
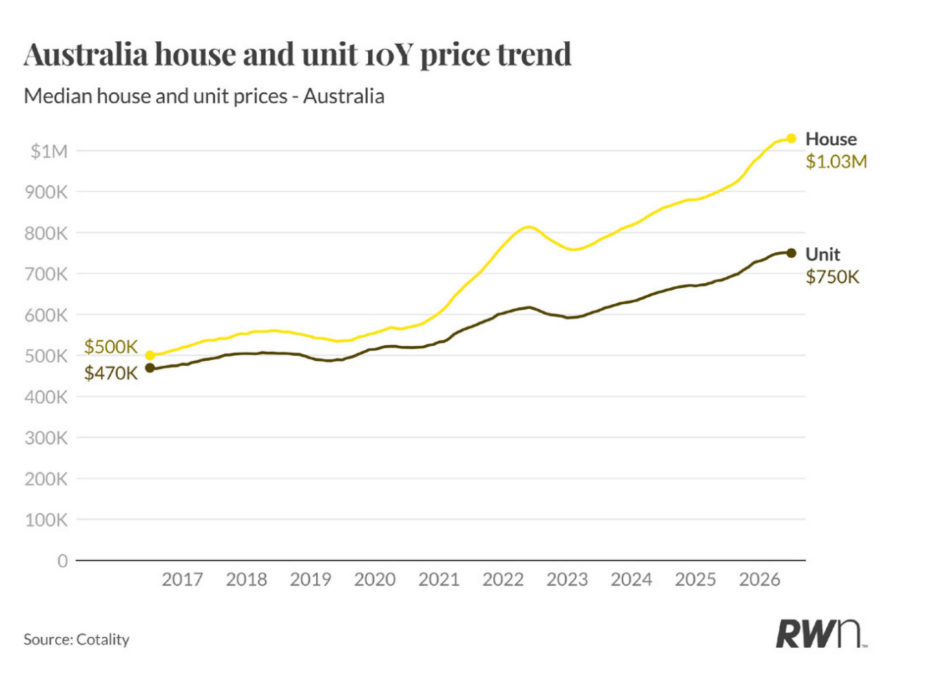
The national median house price now sits at $1.03 million, more than double the $500,000 recorded a decade ago, while the median unit price has grown to $750,000 from $470,000 over the same period. Houses have consistently outpaced units over the decade, particularly through the 2021 and 2024-25 growth phases, widening the gap between the two property types.
The past twelve months have added meaningfully to that long-term trend, even as monthly momentum has begun to slow. The Reserve Bank held the cash rate steady through June after a run of earlier increases, and while inflation continues to ease, now at four per cent, it remains above the RBA’s 2-3 per cent target band, leaving little room for near-term relief. This longer-term view is a useful reminder that periods of softer monthly momentum have historically tended to moderate price growth rather than reverse it.
On a monthly basis, most capitals recorded a decline in June, led by Melbourne at minus 1.3 per cent and Sydney at minus 0.6 per cent, while Darwin was the only capital to hold flat. The major cities result fell 0.7 per cent over the month to $1.17 million, while the national median eased 0.4 per cent to $1.03 million. This broad-based monthly softening follows the Federal Budget’s changes to negative gearing and capital gains tax now being legislated, alongside a further amendment restricting self-managed superannuation funds from borrowing to purchase residential property. Existing SMSF arrangements are protected and a 45-day transition period applies, so the immediate market impact is limited, though it removes another avenue investors had been weighing up as the tax settings around property continue to shift.
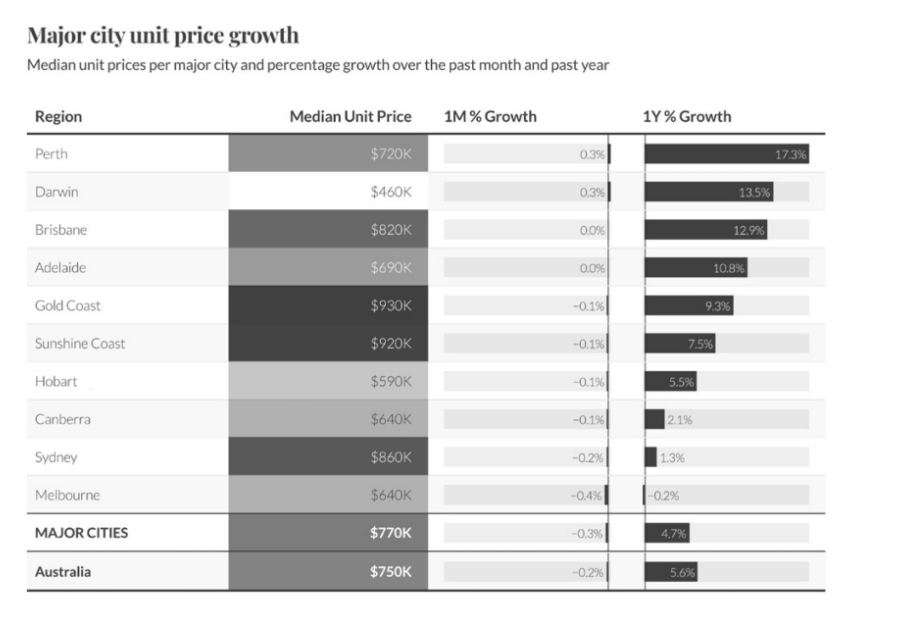
Units have again outperformed houses on an annual basis across most capitals. Perth leads at 17.3 per cent, followed by Darwin at 13.5 per cent, Brisbane at 12.9 per cent and Adelaide at 10.8 per cent. The Gold Coast (9.3 per cent) and Sunshine Coast (7.5 per cent) remain solid, while Hobart (5.5 per cent) and Canberra (2.1 per cent) trail. Sydney unit growth has slowed to 1.3 per cent annually, and Melbourne units recorded a 0.2 per cent annual decline, the only negative result among the capitals.
Monthly movements were mixed rather than uniformly negative, with Perth and Darwin both recording modest 0.3 per cent gains while Sydney and Melbourne eased 0.2 per cent and 0.4 per cent respectively. The major cities unit median sits at $770,000, down 0.3 per cent over the month but still up 4.7 per cent annually, while the national unit median of $750,000 continues to grow faster than the equivalent house figure on a monthly basis, reflecting ongoing affordability-driven demand for higher-density stock.
Average West End Sale Prices July 2026
1 bed apartment $715,000 up 27.7% yoy (Low $605,000 High $840,000)
2 bed apartment $975,000 up 14.8% yoy (Low $820,000 High $1,730,000)
3 bed apartment $1,617,000 up 0.0% yoy (Low $1,320,000 High $3,400,000)
House $2,075,000 up 13.4% yoy
https://lukeokelly.com.au/west-end-stats-july-2026/
REA Stats 03/08/2026

Luke O’Kelly is a real estate agent and auction specialist at Ray White West End, focused on property sales in West End and Highgate Hill. Through Luke O’Kelly Ray White West End, he helps property owners achieve strong results using an auction-led strategy designed to create competition and maximise sale prices. With deep local market knowledge and a hands-on approach, Luke shares insights, sales strategies and suburb updates to help sellers make informed decisions and achieve the best possible outcome.