
Return to 2021 market conditions? Housing growth accelerates in uncertain times
Australia’s housing market shows remarkable resilience with accelerating price growth across houses and units. April data confirms this trend, marking one of the strongest growth periods since 2021.
Growth accelerates across the board
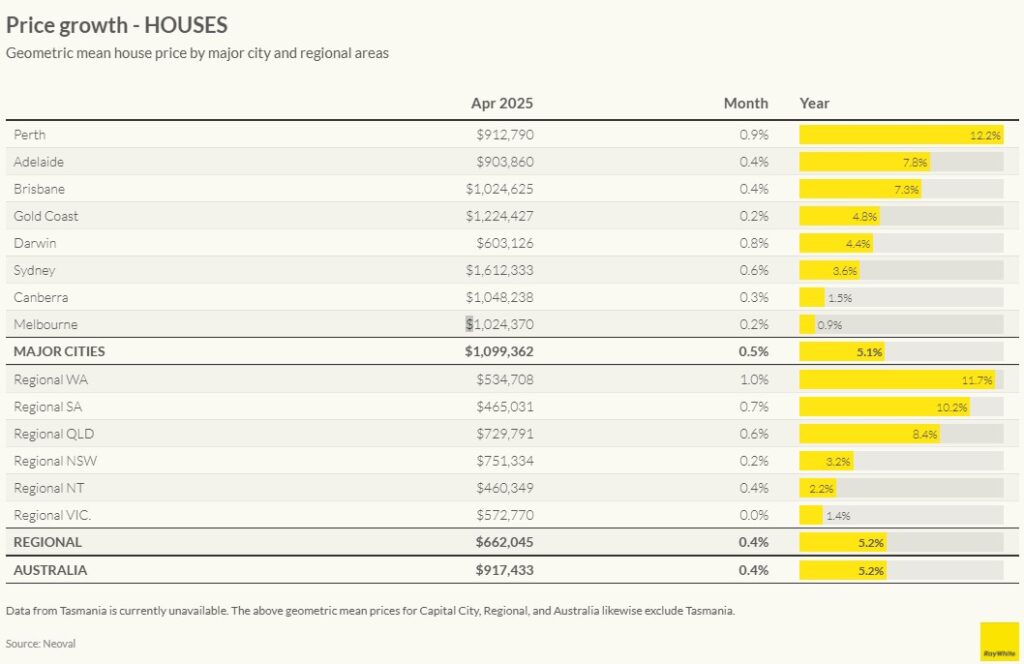
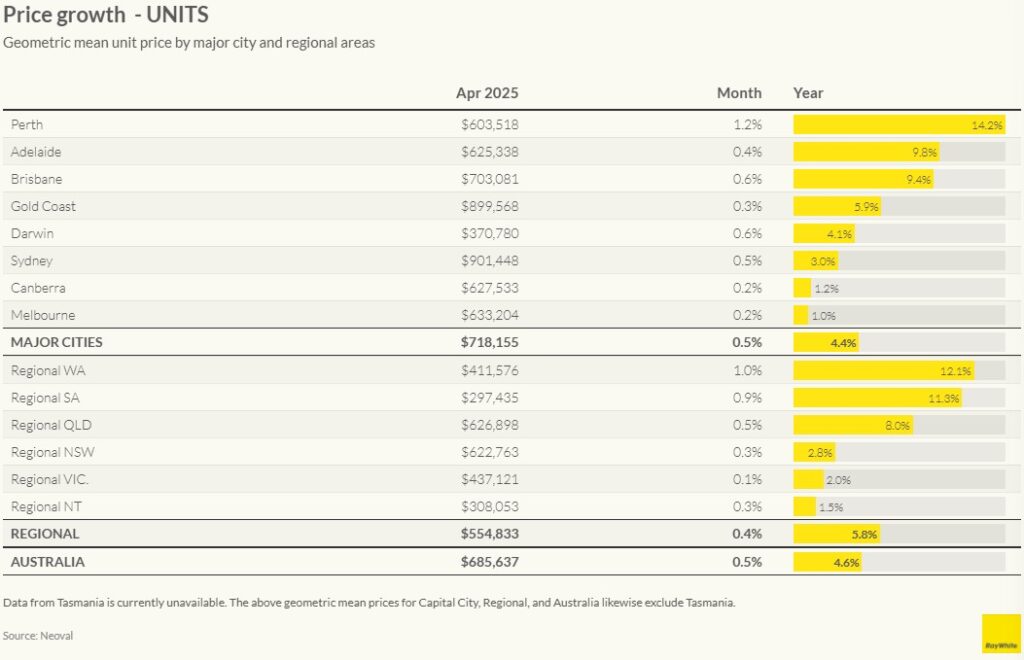
The latest data reveals that house prices nationally rose by 0.4 per cent in April to reach a median of $917,433, representing an annual growth of 5.2 per cent. The unit market showed even stronger monthly momentum with prices increasing by 0.5 per cent to $685,637, delivering a yearly growth rate of 4.6 per cent.
Perth continues its extraordinary run as Australia’s standout performer, with house prices rising 0.9 per cent in April alone, pushing annual growth to an impressive 12.2 per cent. Perth’s unit market is performing even more strongly, with 1.2 per cent monthly growth and a remarkable 14.2 per cent annual increase.
The two-speed market that characterized 2024 persists but is showing signs of convergence. While Perth, Adelaide and Brisbane lead with robust price growth, the traditionally stronger southern capitals of Sydney, Melbourne and Canberra are now showing clear signs of acceleration, albeit from a lower base.
Outlook: Stronger conditions ahead
Several factors suggest even stronger conditions ahead for Australia’s housing market:
Interest rate cuts: With markets pricing in multiple cuts beginning in May, borrowing capacity will increase, supporting further price growth
Global uncertainty: Financial market volatility will likely drive investors toward the relative safety of residential property
Supply constraints: The construction industry’s ongoing challenges will limit new supply, supporting existing property values
Policy stimulus: Election policies targeting first home buyers will inject additional demand into an already strengthening market
The data presents a clear picture: property price growth that began in January has gained momentum through February, March, and now April. With interest rate cuts on the horizon and increasing investor interest in the stability of residential property amid global volatility, this momentum appears likely to continue through the remainder of the second quarter.
Nerida Conisbee – Chief Economist
Average West End Sale Prices April 2025
1 bed apartment $530,000 (Low $425,000 High $675,000)
2 bed apartment $810,000 (Low $660,000 High $1,220,000)
3 bed apartment $1,600,000 (Low $1,000,000 High $3,250,000)
House $1,695,000
REA 2/5/2025